Automated GMB Reporting
White label, flexible, Google My Business reporting.

White Label
Fully brandable
Automated
Set and forget
Multilocation
Grouped insights
Generate beautiful reports that are delivered to your clients or shareholders outlining how your GMB listings performed across a variety of metrics and insights.
Schedulable
Monthly Or Weekly
Emails
Summary notifications
PDF Download
Download and print
Public URL
Viewable anywhere
Easy Insight Comparisons
Quickly see changes in your GMB insights at a glance. Click through every metric to see how they performed month over month. View aggregate insights for groups of locations and broken down stats in the same report.
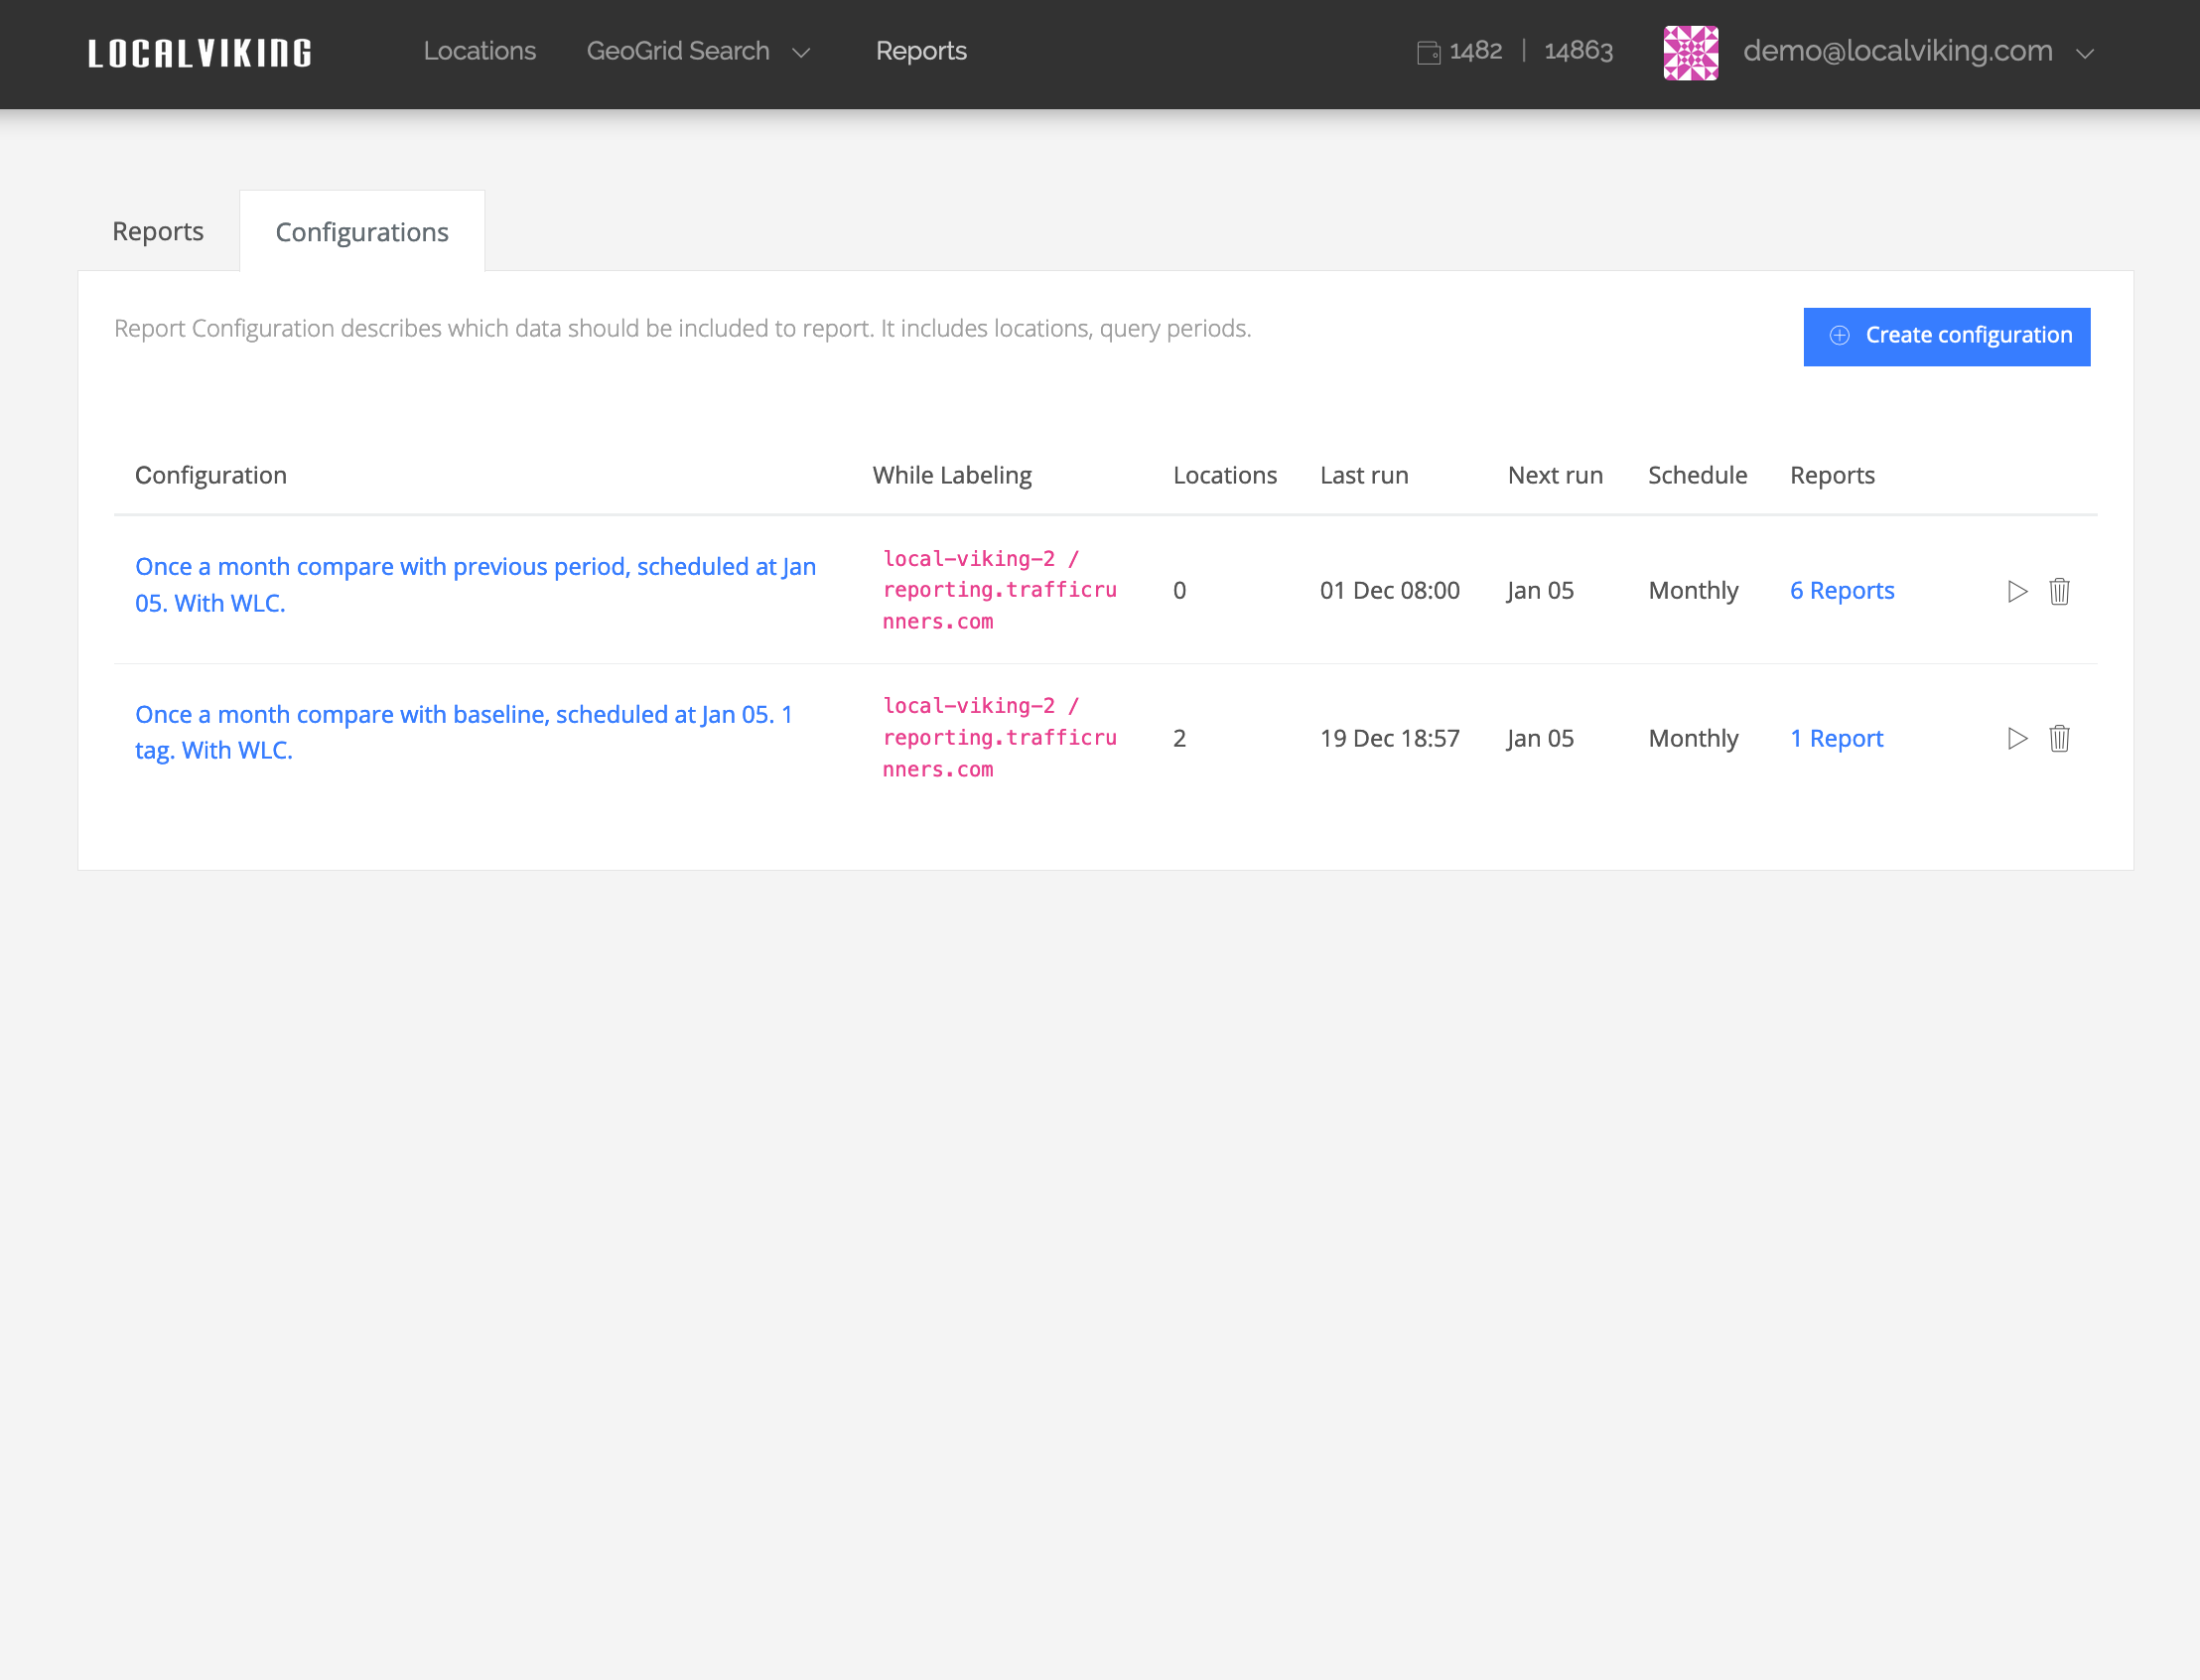
Flexible Configurations
Flexibly create reports to run on the schedules you need, for the locations you want to track. Only show the insights you want to your clients, when you want.
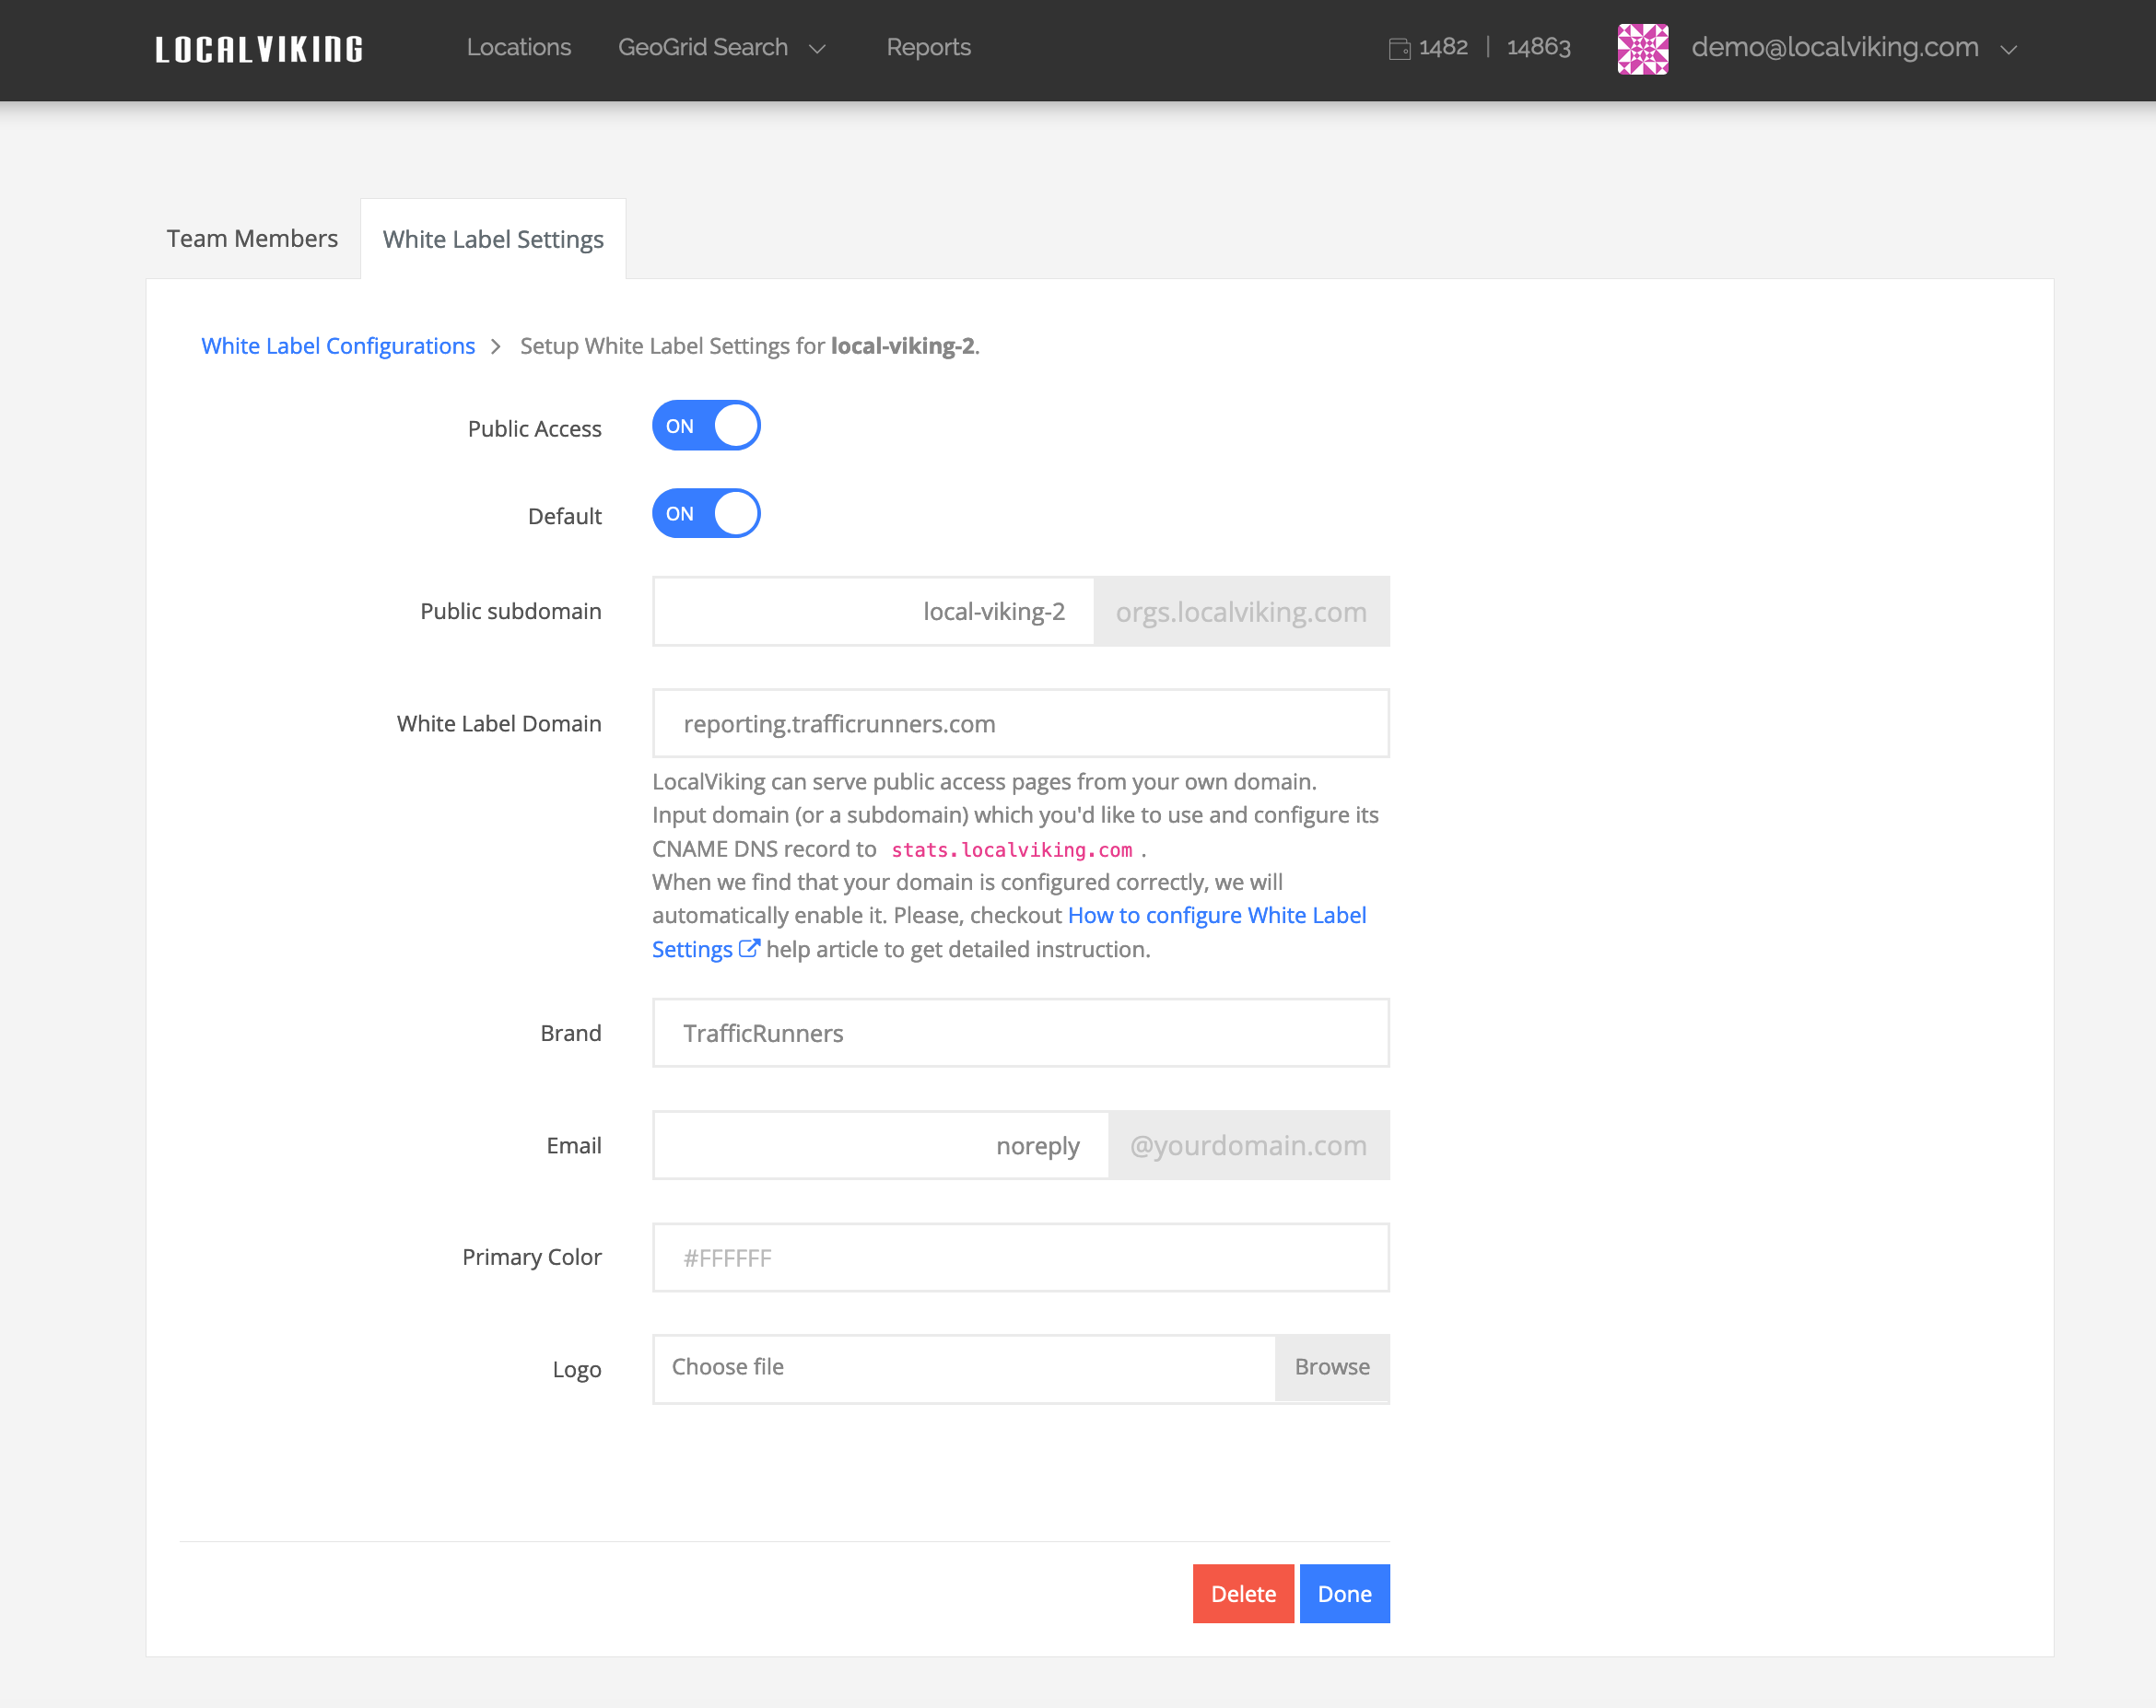
Full White Labeling
Customize every aspect reports to your company's branding. Send emails from your domains, host reports on your sub domain and use your colors and logo.
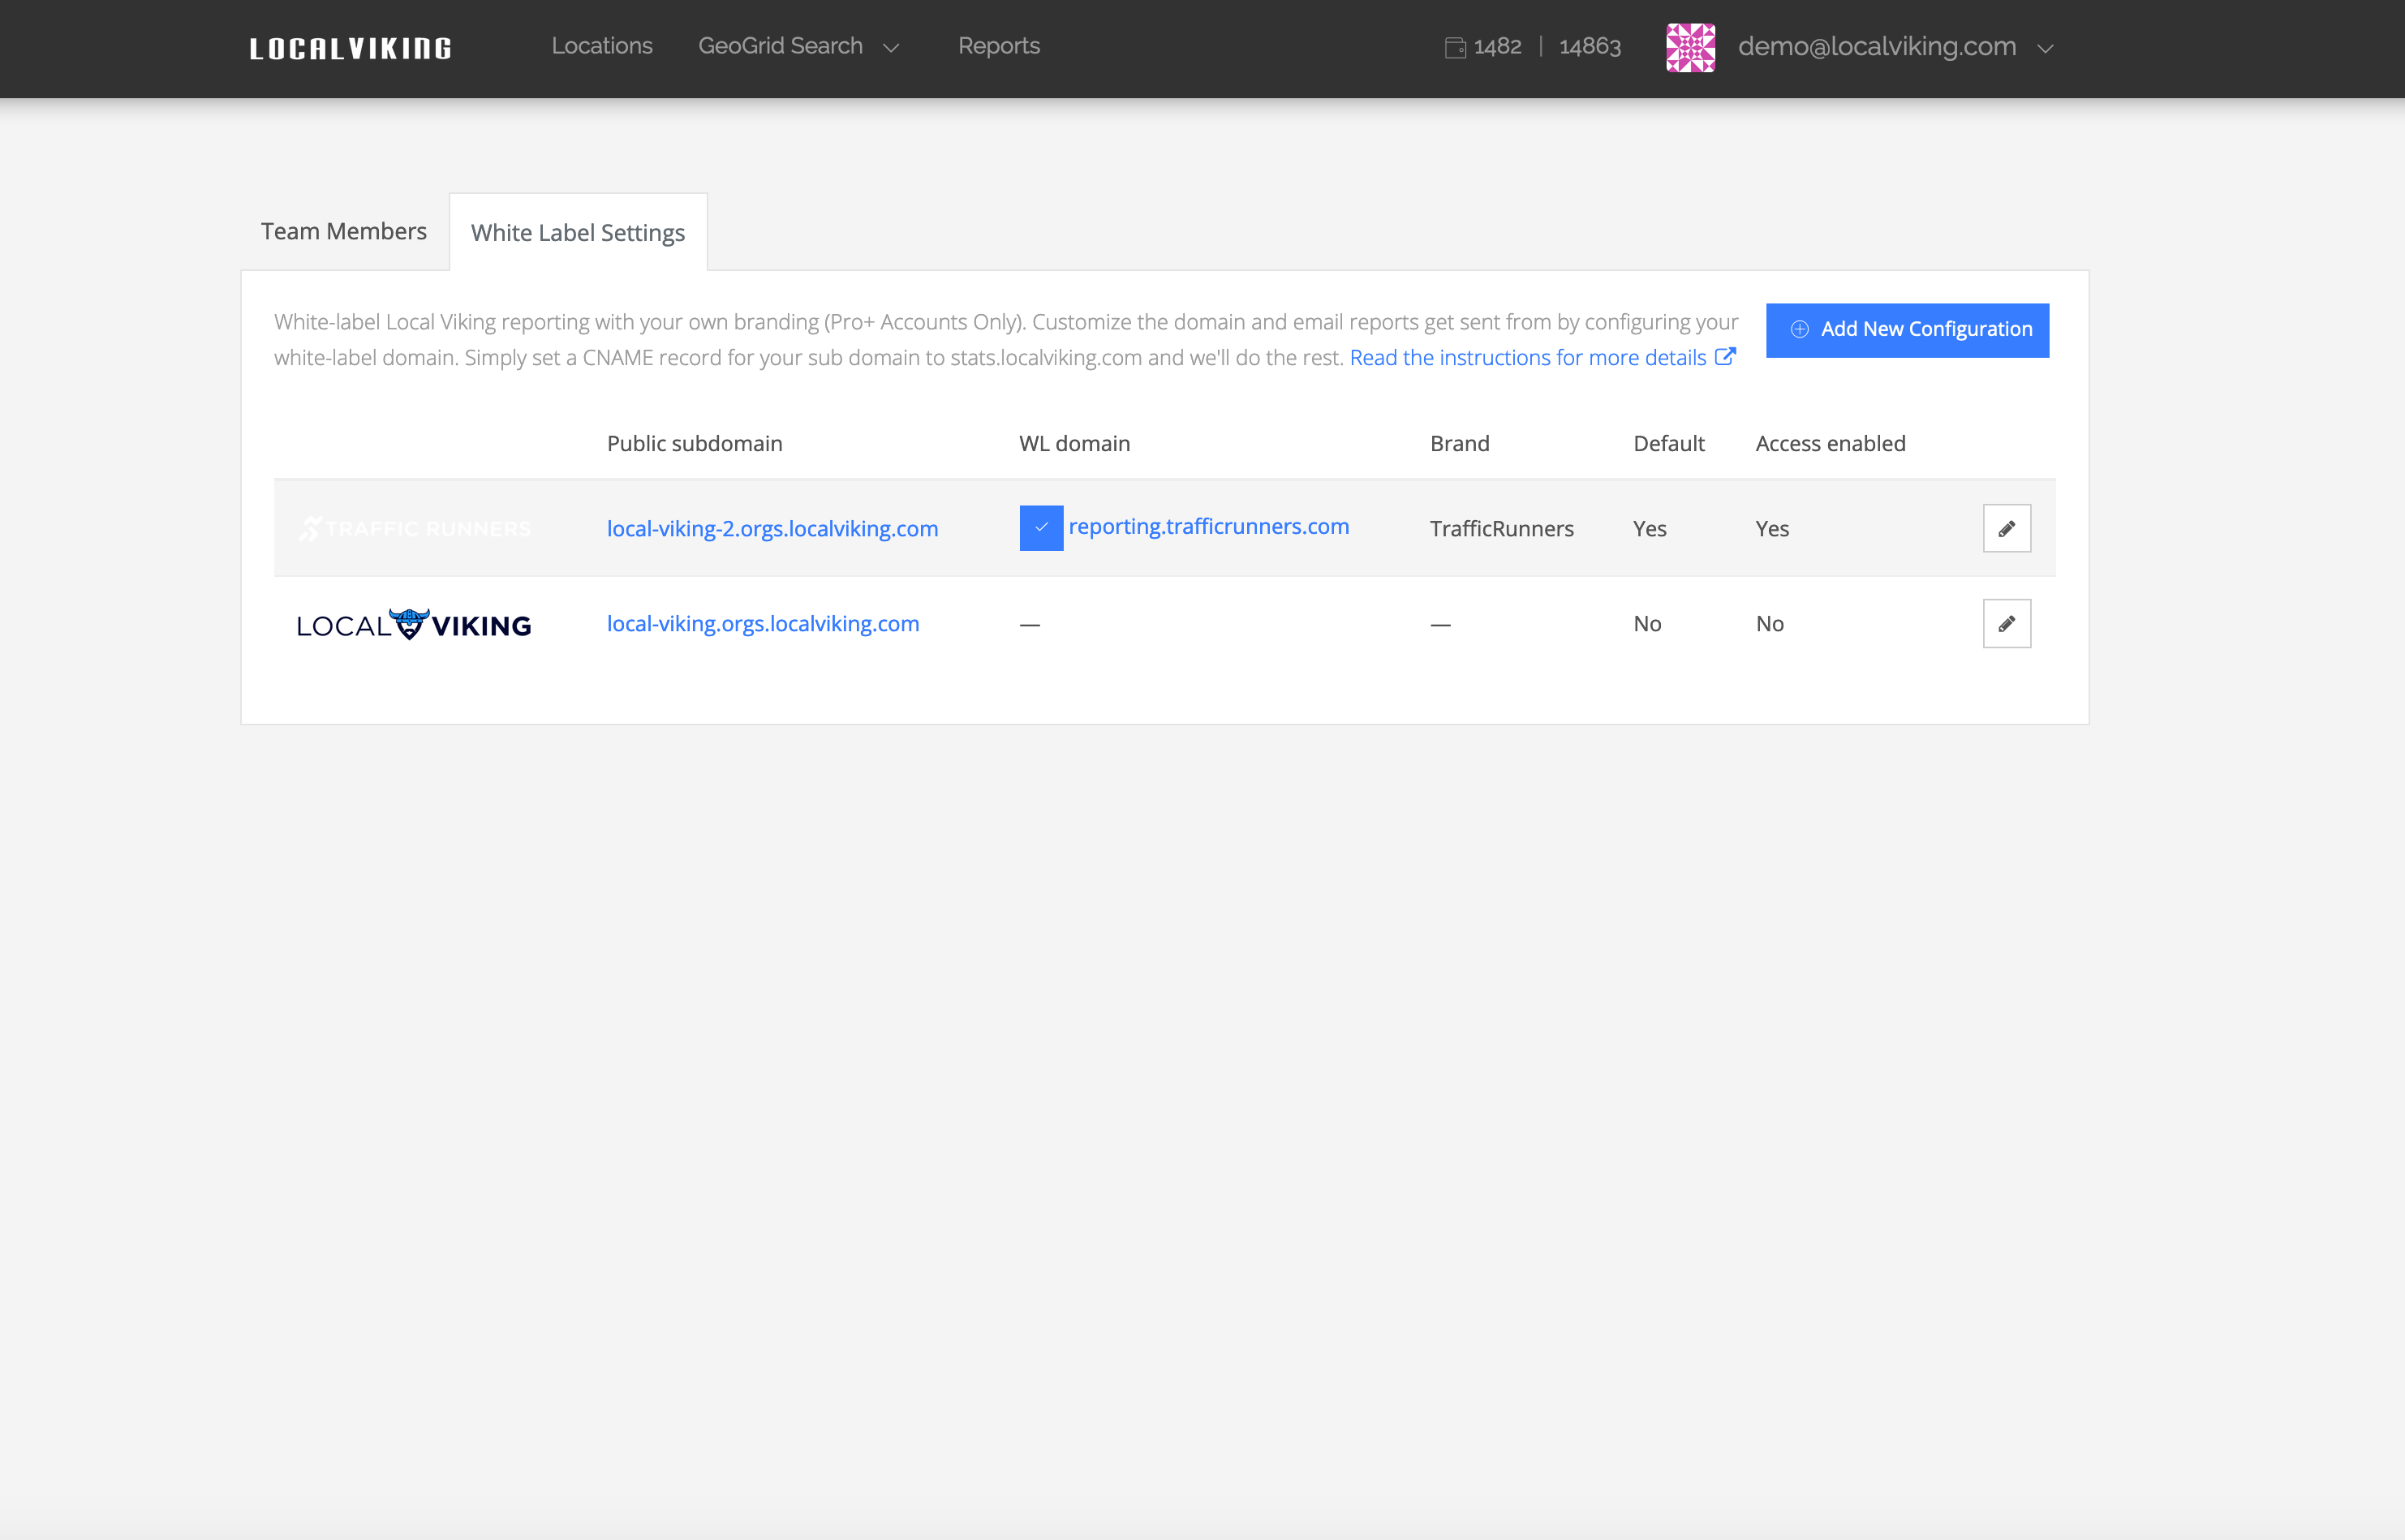
Flexibly Brand Reports
White label reports from as many brands as you want, each with custom domains, logos and colors.
The Most Powerful GMB Reporting Suite
Here at Local Viking, we had three goals when creating a reporting mechanism you can use for your clients and team. The first was to beautify the process while keeping the aesthetics of the data presentation clean and concise. Secondly, we wanted to simplify the consumption of this data; your clients are not overwhelmed with extraneous graphs, numbers, or unimportant KPIs. We tried to cut out the vanity metrics and display what matters. Lastly, we wanted to build an automated system that put your client reporting on autopilot.
On behalf of Local Viking, we are proud to present what we believe accomplishes all of these goals, the last local reporting suite you will ever need.
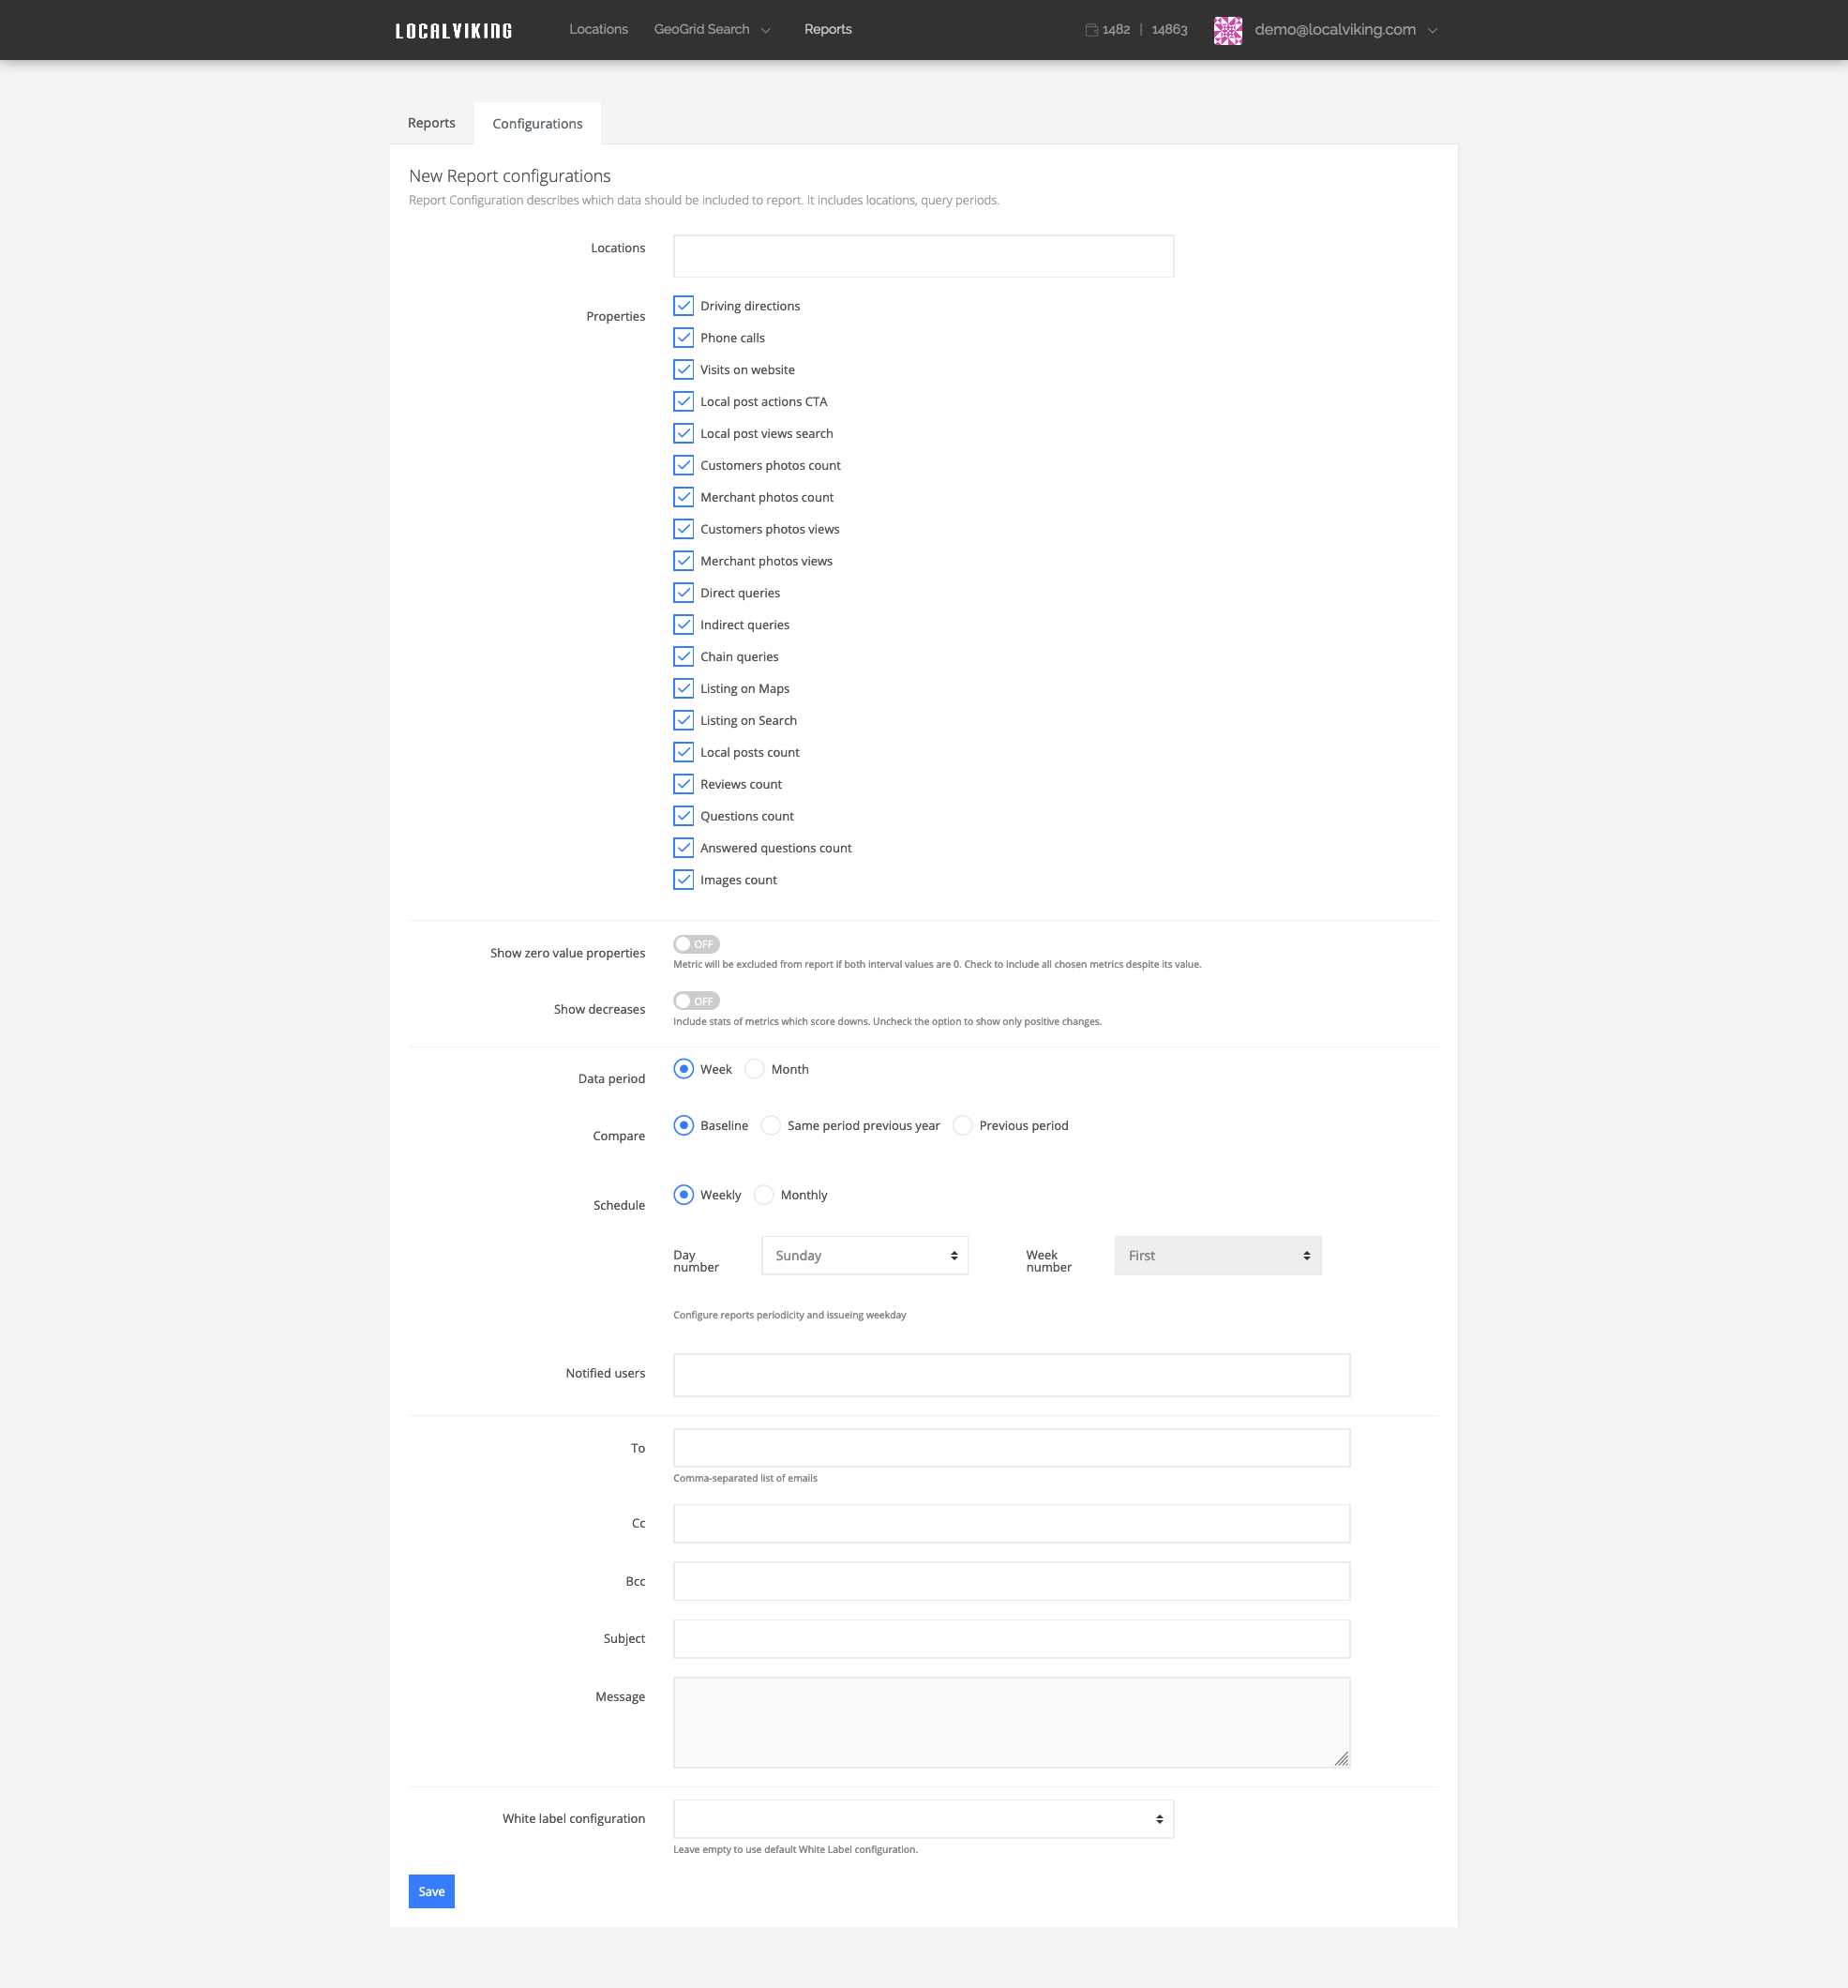
Let’s start off talking about configurations and having complete control over your reporting experience. You can choose any or all of the nineteen GMB insight key performance indicators to showcase in your report. Embedded below is a video explaining what each of these metrics means.
You can also group locations in the config area to keep multi-location clients organized and consolidated.
GMB Reporting For Agencies
Coming from the background of years of agency experience and running multiple seven-figure client-facing businesses, believe me when I say we talked to a lot of clients in our day. I have been on too many client calls to remember. Do you hate when 80% of the conversation is focused on one or two slightly negative things, and the massive wins are not appropriately celebrated or overlooked altogether?
We give two options inside of the reporting ecosystem to help focus the conversation on your wins while your team handles downturns behind the scenes. LV enables you to eliminate showing anything with 0 value. Some of these KPIs might not even be impactful enough to affect your client, but you want to show increases if they happen. So, leave them enabled and choose to hide them if they are at a 0 come time of reporting.
The other option is toggling off, showing decreases. Again, this is not to deceive a client, but something experiencing a few percentage point reduction should not overshadow conversations about substantial increases. Go ahead and choose not to show metric decreases and handle it internally at your agency and keep client conversations positive.
As a Local Viking user, you can select which data period you want to show in the report, week, or month. We offer three comparison options, which are baseline, the same period as the previous year, and the last period.
Notify all of the users that you added to the platform. Ensure all of your team members know when reports are going out and what data they contain. There is no longer a need to use third-party apps or additional communication loops to see each client’s GMB insights and ranking data.
Automate Your Reporting
Automate the sending of your reports with our simple templating system that allows you to add what email addresses reports should be sent to and customize your title and message. If you are eligible for our white label option, then you can also select which white label company the reports will be sent from as well.
Stop relying on archaic or incomplete reporting tools for your local client agency.
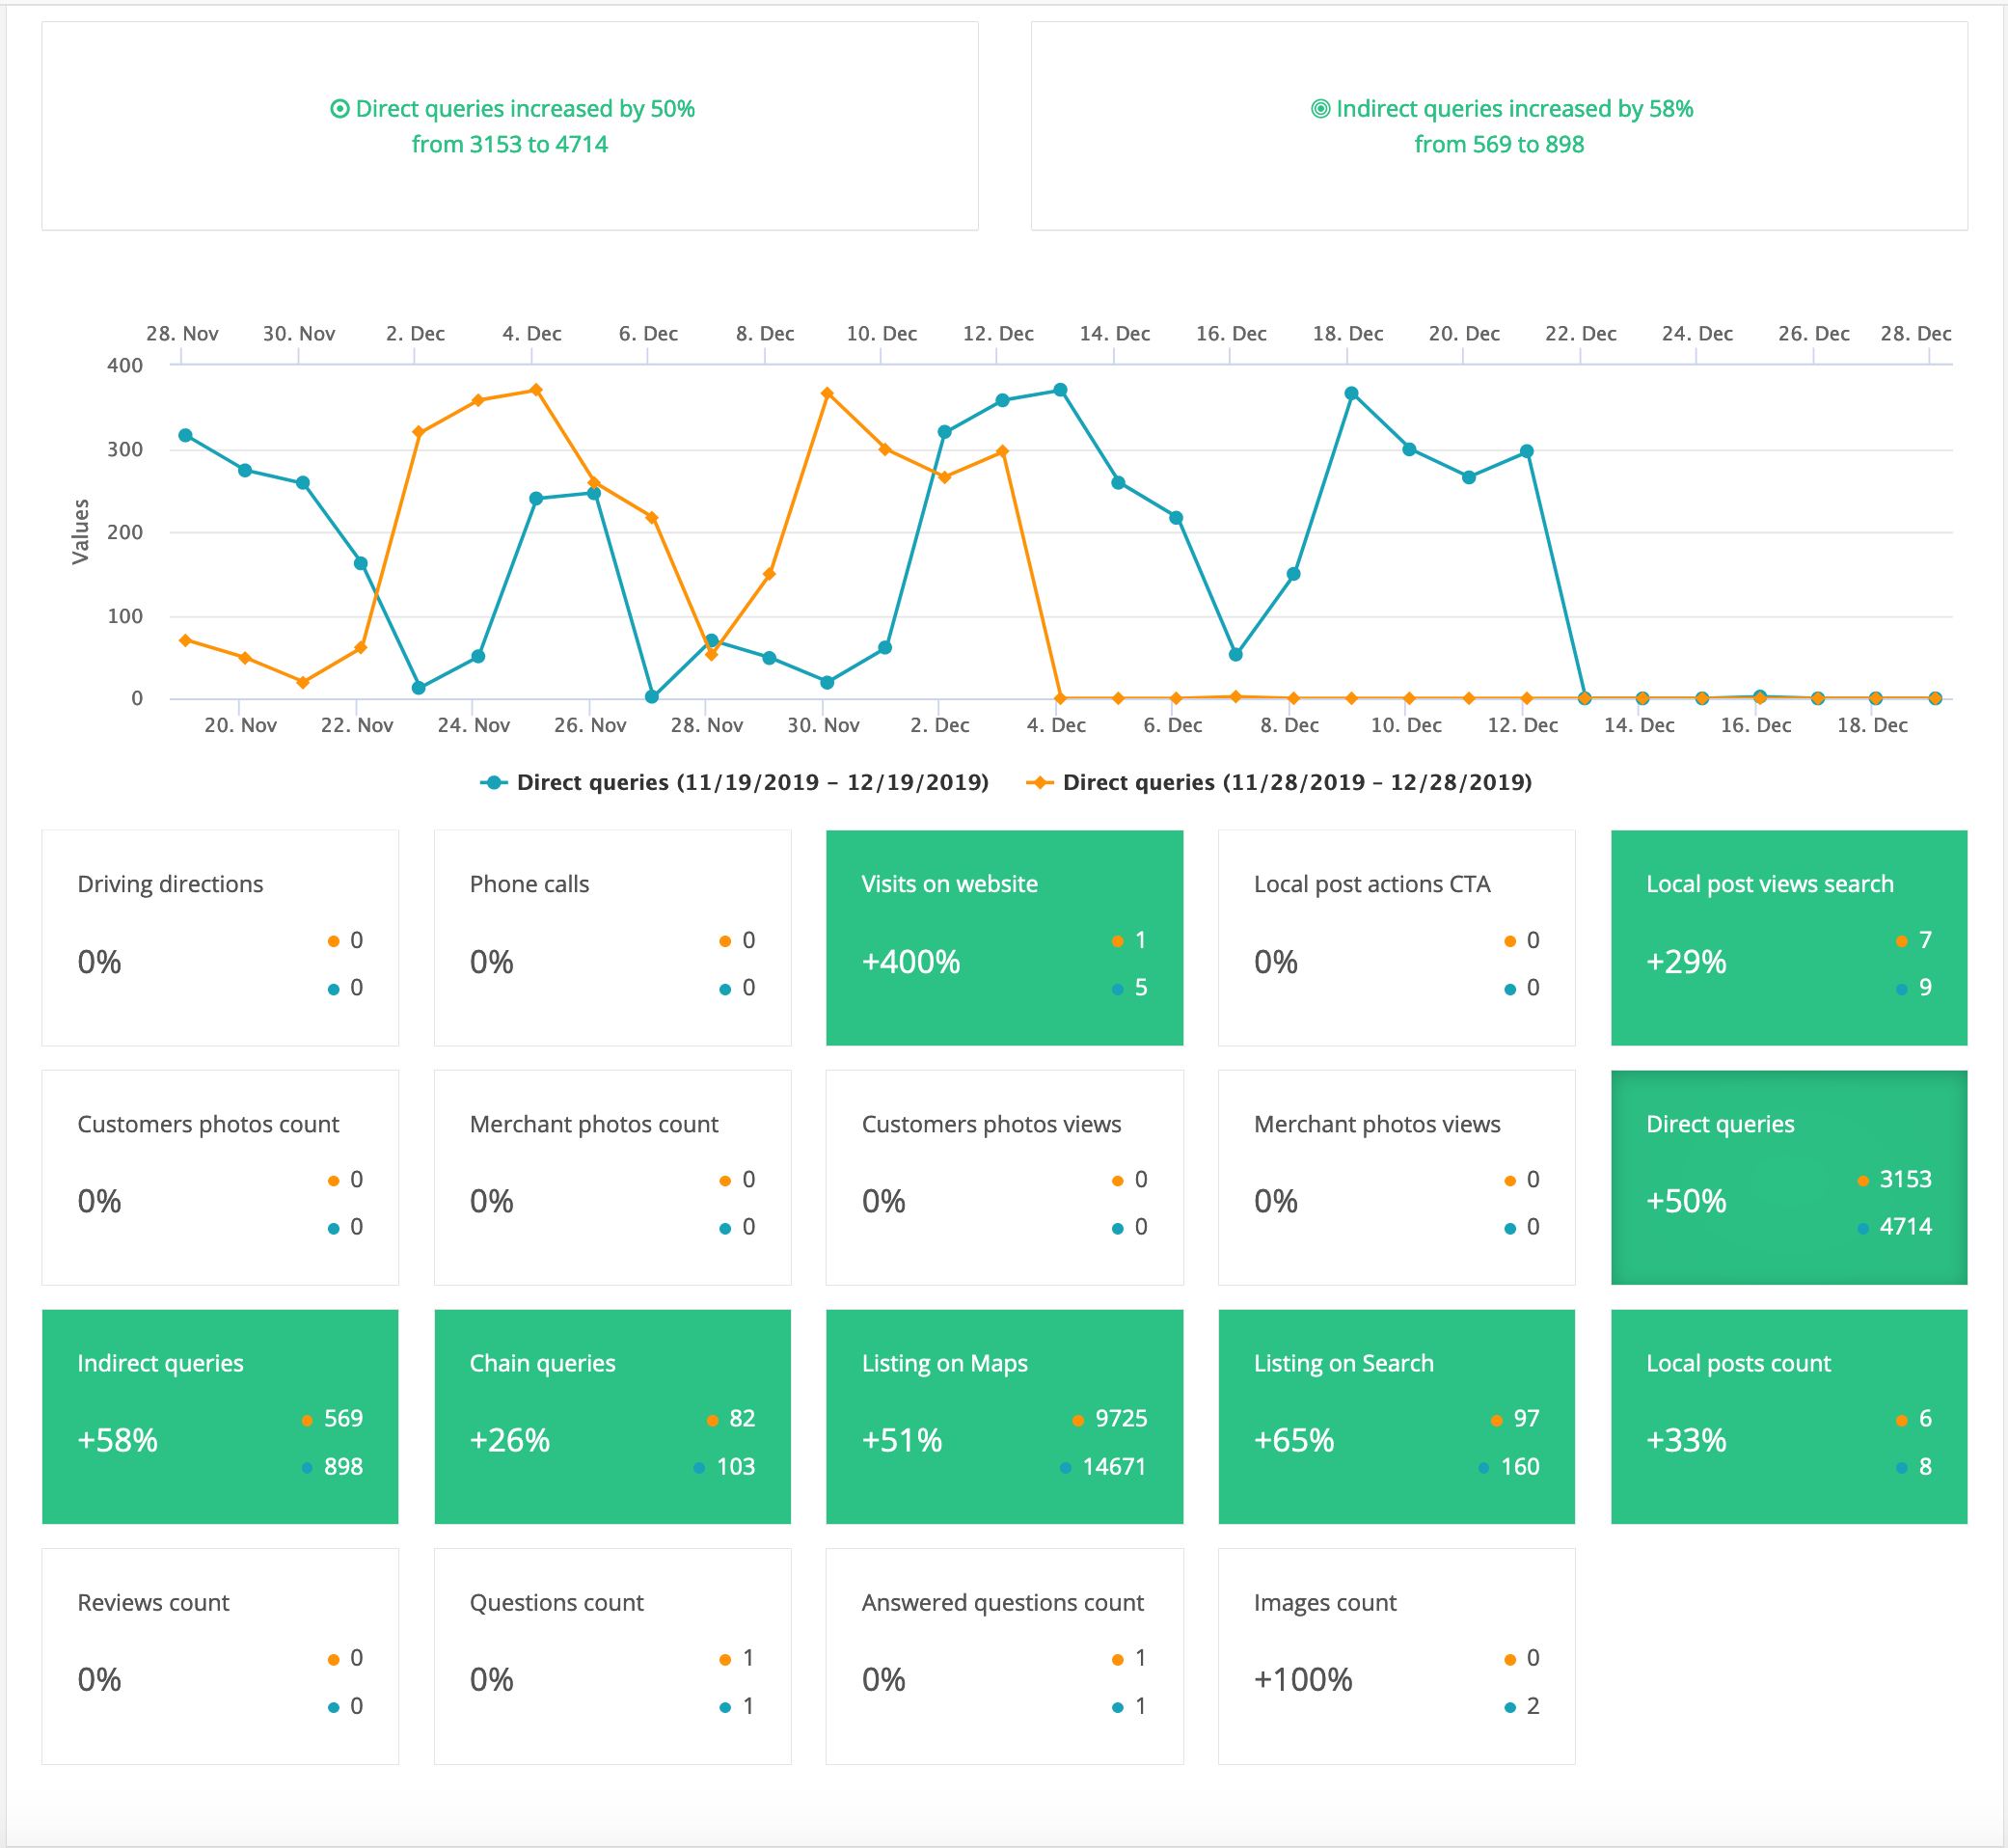
Our end-users (the clients) love the aesthetic of our reports. Heck, our agencies are assuring us we are on the right track as well. At the top of each section, we pull the wins out of the insight table and give a bulleted list of increases and information that the client should be focusing on for this reporting period.
The dynamic graph in each section will change as you click each of the cards underneath it showing KPIs in a more visual format. Simple. Clean. Effective. Like local reporting should be.